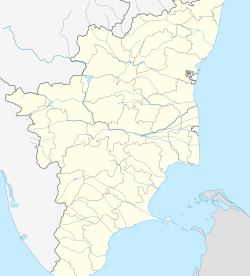
In the district, horticulture crops occupy a relatively high proportion of gross cropped area, raising the economic viability of solar pumps here. Overall, water availability for irrigation in the district (based on ground water development and long-term trends of water level decline) is within the safe limit, enhancing long-term sustainability of solar pumps. The average monthly per capita expenditure of rural agricultural households is relatively high for the district, suggesting higher purchasing capacity of the farmers here. The district has a relatively high proportion of small and marginal farmers. The district appears in the group of districts, which show (very) low vulnerability towards climate change, as per an index constructed by CRIDA.
Deployment Approaches
| Approaches | Feasibility |
|---|---|
| Individually owned off-grid solar pumps | Limited Suitability |
| Solarisation of feeders | Limited Suitability |
| Solar based water as a service | Limited Suitability |
| Promote 1 HP and sub-HP pumps | Limited Suitability |
| Solarisation of individual grid-connected pumps | Limited suitability |
Individually owned off-grid solar pumps
Limited Suitability
The district has ground water available within the safe limit and a relatively high disbursement of institutional credit. But, low crop revenue per holding, and a comparatively low concentration of diesel pump users make it difficult to promote the private ownership of solar pumps here.
| Parameter | Value | Percentile |
|---|---|---|
| Number of cultivators reporting use of diesel pumps | 1,824 | 23 |
| Water Availability Index | 0.97 | 96 |
| Crop revenue per holding (INR) | 21,479 | 12 |
| Medium and long term institutional credit disbursed in a year (in INR Crore) | 22.2 | 47 |
Solarisation of feeders
Limited Suitability
The district has a relatively high penetration of electric pumps, and its DISCOM incurs a high cost for supplying power, but the district has a comparatively low extent of feeder segregation. Solarisation of the feeders will only be possible once the district separates agricultural feeders from the rest.
| Parameter | Value | Percentile |
|---|---|---|
| Actual cost of power supply (INR/kWh) | 6.69 | 84 |
| Extent of feeder segregation | 0% | 0 |
| Proportion of cultivators reporting use of electric pumps | 26% | 75 |
Solar based water as a service
Limited Suitability
Groundwater availability in the district is within safe limit and the concentration of small and marginal farmers is comparatively high, but the proportion of unirrigated area is relatively low. A solar-based water service will have to compete with existing sources of irrigation.
| Parameter | Value | Percentile |
|---|---|---|
| Water Availability Index | 0.97 | 96 |
| Proportion of small and marginal cultivators | 99% | 96 |
| Unirrigated net sown area as a share of total net sown area | 19% | 21 |
Promote 1 HP and sub-HP pumps
Limited Suitability
The district has a relatively high proportion of horticulture crops under gross cropped area, high concentration of marginal farmers and groundwater availability within the safe limit, but disbursement of institutional credit to marginal farmers is comparatively low. Greater support, either through subsidies or credit, would be required to enable marginal farmers to adopt solar pumps.
| Parameter | Value | Percentile |
|---|---|---|
| Area under horticulture crops as a share of gross cropped area | 46% | 94 |
| Water Availability Index | 0.97 | 96 |
| Proportion of marginal cultivators | 98% | 99 |
| Medium and long term institutional credit disbursed in a year (in INR Crore) | 22.2 | 47 |
Solarisation of individual grid-connected pumps
Limited suitability
The district has a relatively high penetration of electric pumps, ground water available within the safe limits, and power supply to its agricultural consumers is heavily subsidised, but the district has a comparatively low extent of feeder segregation. Solarisation of individual grid-connected pumps will only be possible once the district separates agricultural feeders from the rest.
| Parameter | Value | Percentile |
|---|---|---|
| Water Availability Index | 0.97 | 96 |
| Actual cost of power supply (INR/kWh) | 6.69 | 84 |
| Extent of feeder segregation | 0% | 0 |
Leveraging Solar Pumps to Promote Policy Objectives
If you are deploying solar pumps in this district then you can further these policy objectives.
Doubling Farmers’ Income – Capital Investment
Given the high concentration of small and marginal farmers, and their relatively better access to institutional credit, the district is suitable for doubling farmers’ income through capital investment. Solar pumps could be one of the farm technologies to invest in for farmers, especially 1 HP or sub-HP pumps for marginal farmers.
| Parameter | Value | Percentile |
|---|---|---|
| Proportion of small and marginal cultivators | 99% | 96 |
| Medium and long-term institutional credit disbursed in a year to small and marginal cultivators (in INR Crore) | 22.2 | 47 |
Per Drop More Crop
In the district, crops suitable for drip and sprinkler irrigation occupy a relatively high proportion of gross cropped area, making it easy to adopt such high precision irrigation methods. Solar pumps, along with other efficient and precise water application devices, could be deployed under Per Drop More Crop to promote efficient irrigation.
| Parameter | Value | Percentile |
|---|---|---|
| Area under crops suitable for drip and sprinkler irrigation as a share of total cropped area | 82% | 97 |


