Council on Energy, Environment and Water Integrated | International | Independent
Suggested Citation: Arora, Chetna, Pallavi Das, and Vaibhav Chaturvedi. 2023. The Emissions Divide: Inequity Across Countries and Income Classes. New Delhi: Council on Energy, Environment and Water.
This issue brief aims to highlight consumption-driven emissions inequities among income classes, both within and across nations. It examines a diverse range of developed and developing economies, accounting for approximately 81 per cent of global emissions, 86 per cent of the world's GDP, and 66 per cent of the global population.
The analysis relies on per capita CO2 emissions data for various income groups from the World Inequality Database (WID), and income deciles from the Poverty and Inequality Platform, World Bank. Using these indicators, the study focuses on the stark inequities in consumption-driven emissions, especially among the affluent in developed countries, and estimates the potential carbon budget savings achievable through the adoption of low-carbon lifestyles by top emitters.
Carbon dioxide (CO2 ) emissions have increased worldwide due to fossil energy-intensive economic development. However, the distribution of these emissions is highly unequal. Between 1990 and 2015, half the consumption-driven CO2 emission increase globally can be linked to the richest 10 per cent (Kartha 2020). Hence, it is crucial to recognise that the affluent, especially in developed nations, have played a substantial role in increasing global carbon emissions. With limited carbon space left, the global climate discourse has begun paying more attention to equity and the principles of common but differentiated responsibilities and respective capabilities (CBDR-RC).
Our study explores consumption-driven emissions and their correlation with energy-intensive lifestyles and resource consumption, particularly among the affluent. We further analyse the varying degrees of inequity across selected countries as well as the potential carbon budget savings achievable if top emitters transition to low-carbon lifestyles.
We consider a diverse range of developed and developing economies and regions, including Argentina, the Association of Southeast Asian Nations (ASEAN), Australia, Brazil, Canada, China, the European Union (EU), India, Japan, Mexico, the Russian Federation, Saudi Arabia, South Africa, Turkey, the United Kingdom (UK), and the United States (US). These major economies collectively represent approximately 81 per cent of global emissions, 86 per cent of the world’s gross domestic product (GDP), and 66 per cent of the global population. As a result, our analysis offers a comprehensive view of global emission dynamics in the development context.
We compiled per capita CO2 emission information for different income brackets, including the highest 1 per cent, the top decile (top 10 per cent), and the lowest decile (bottom 10 per cent), using data sourced from the World Inequality Database (WID). We collected data on the income share of the top 10 per cent and the national income from the World Bank database. We assessed emissions inequity using various metrics, including annual per capita CO2 footprint across various income classes, the relative CO2 footprint index, the emissions intensity of income, and estimated potential carbon budget savings and revenue generation if a tax is levied on top emitters.
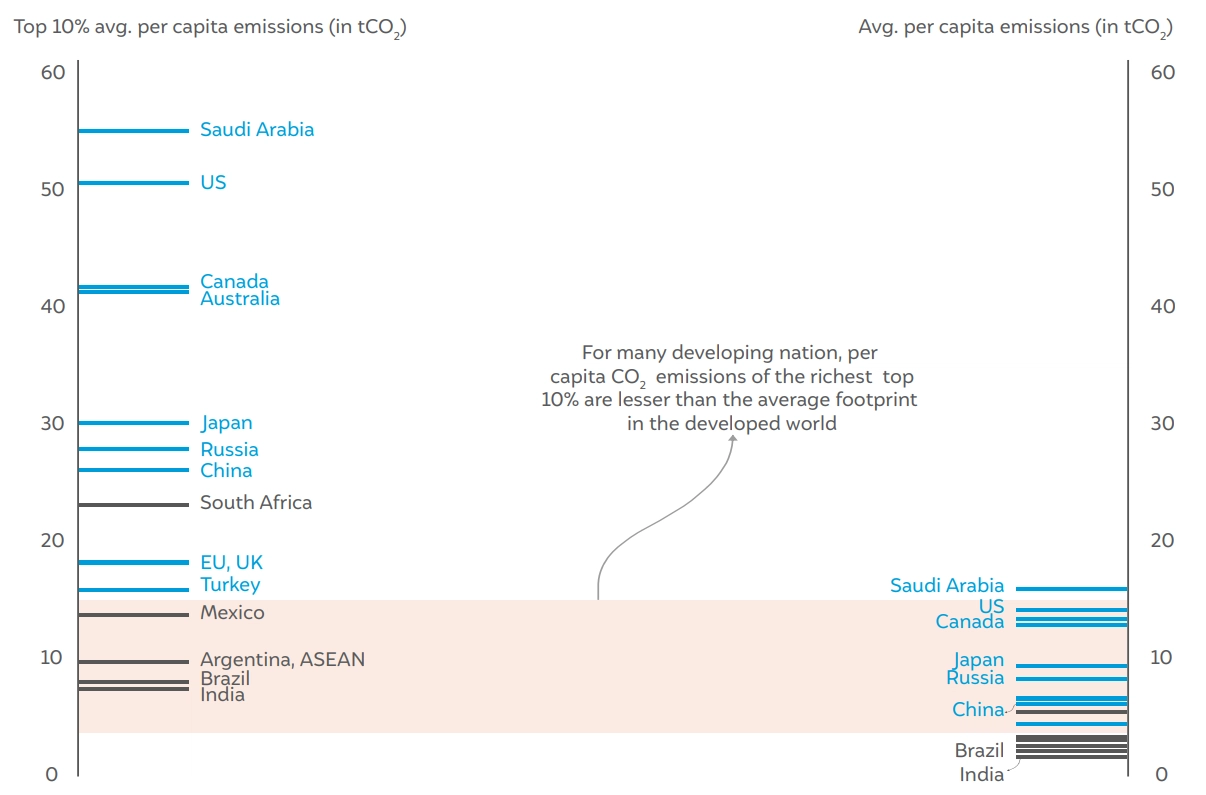
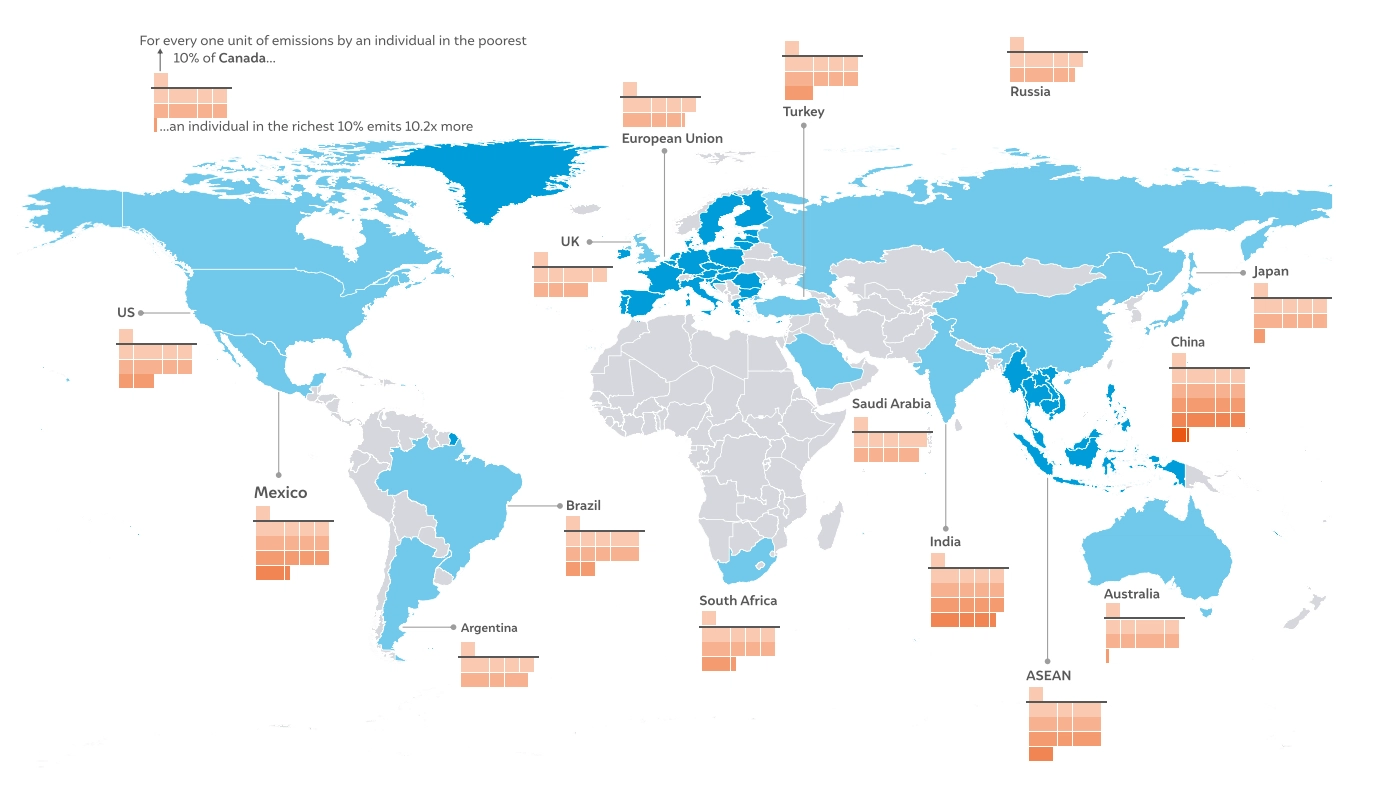
The per capita CO2 emissions of the richest individuals reveal significant cross-country inequalities. The per capita CO2 footprint of the top 1 per cent and the top 10 per cent income groups in developed countries is noticeably higher – even four to eight times greater in some cases – compared to their counterparts in developing nations. For example, an individual from the richest 1 per cent income bracket in the US, Australia, or Saudi Arabia emits 228 tCO2 , 197 tCO2 , or 182 tCO2 , respectively, while the top 1 per cent in India emits just about 31.7 tCO2 , which is six to seven times lower (2019 data). The emission inequity is so stark that individuals in the top 10 per cent income group in developing nations emit less CO2 than an average earner in developed countries, as illustrated by Figure ES1.
Figure ES1 Average per capita emissions in developed countries are comparable with the richest 10% in developing countries
Source: Authors’ compilation
Inequalities are even more pronounced as we move down the income pyramid. Examining per capita CO2 emissions across the income spectrum in selected countries reveals a striking pattern – particularly, the huge difference between the highest decile and the second-highest decile and, by extension, all the other deciles. In 2019, the top 10 per cent in developed1 countries considered in our analysis along with China collectively emitted over 6.8 billion tonnes of CO2 . This amount is 22 per cent higher than the total CO2 emissions from all the developing countries in our analysis and more than twice India’s annual emissions in the same year. The disparities are even more pronounced when we compare the poorest decile. An individual in the bottom 10 per cent of Saudi Arabia, the US, or Australia emits 10 to 15 times more CO2 than an individual in the poorest decile of India.
Even within countries, CO2 emissions reveal significant inequities between the wealthiest and poorest income brackets. The difference in the CO2 footprint between the top and bottom income deciles ranges between 8 and 22 times for the selected countries. In countries such as China, Mexico, and the ASEAN region, an individual in the top 10 per cent emits roughly 17 to 21 times more CO2 compared to an individual in the bottom 10 per cent of the same country. On the other hand, in countries such as Australia, Japan, 1 Developed countries referred in the text include Australia, Canada, the European Union (EU), Japan, the Russian Federation, Saudi Arabia, Turkey, the United Kingdom, and the United States. and Argentina, the difference is between 9 to 12 times. These differences are indicative of the underlying socioeconomic differences that exist.
The emission intensity of income earned has reduced among the highest income decile in most countries. While individuals emitted less CO2 per USD 1000 earned in 2018 compared to 2008, the progress is not uniform across countries and ranges between 4 per cent to 40 per cent. Only Turkey, Russia, and Brazil saw an increase in the emission intensity of income earned of approximately 5 to 5.5 per cent. Although emissions per USD 1000 of income earned decreased between 2008 and 2018, overall emissions increased due to the significant rise in income levels.
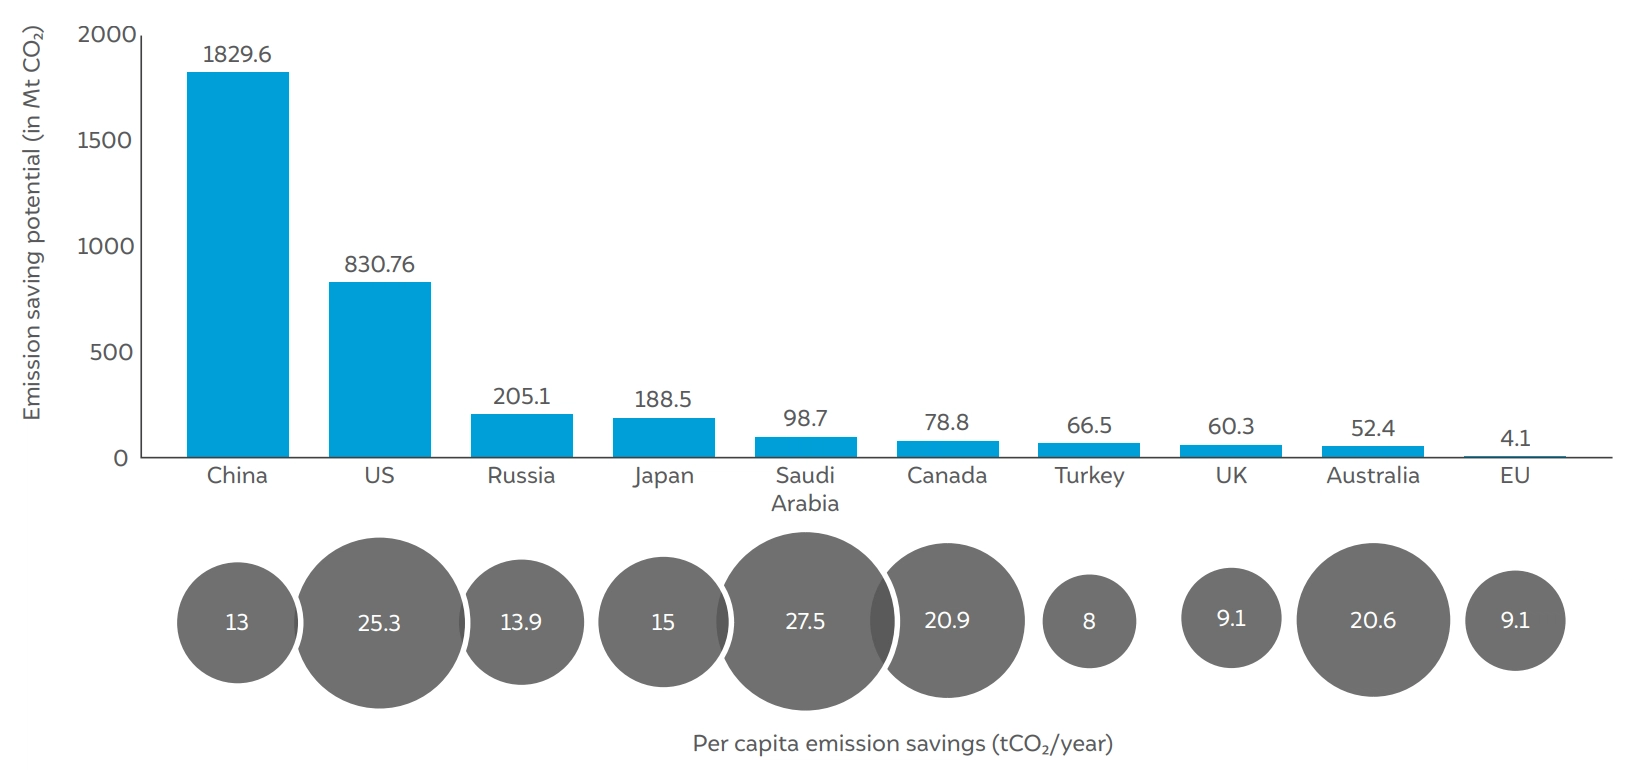
If the richest decile from developed countries and China reduce their CO2 footprint by half, they can still save more than 3.4 billion tonnes of CO2annually (based on 2019 data). The top 10 per cent earners in any country emit approximately three to five times more CO2 per capita than the national average. Encouraging the adoption of low-carbon lifestyles among this group can lead to significant annual reductions in CO2 emissions. Even if they reduced their per capita emissions by 50 per cent, they would still be emitting 1.5 to 2.5 times more than the national average.
Figure ES2 Top 10% in developed nations and China adopting low-carbon lifestyles could save 3.4 billion tonnes CO2 yearly
Source: Authors’ analysis
This potential carbon saving, equivalent to 3.4 billion tonnes, amounts to roughly 60 per cent of the total CO2 emissions of all the developing countries and regions analysed in our study in 2019, which includes countries like Argentina, Brazil, India, South Africa, Mexico, and members of the ASEAN region. This saving potential exceeds India’s total CO2 emissions for the same year by 40 per cent, emphasizing the substantial impact of these emission savings on a global scale.
A carbon tax on the top 10 per cent of selected countries can shore up USD 500 billion and discourage highly carbon-intensive consumption patterns. These funds can be used for climate change mitigation, research and development, de-risking clean technology, and building resilience to mitigate climate change impacts. However, implementing a carbon tax that targets specific income brackets may have certain implications and complexities. Therefore, it requires a well-designed policy that carefully considers both environmental and socioeconomic consequences.
Our study reveals the skewed disparities in per capita CO2 emissions across different income groups and countries. The top 10 per cent of the population in developed countries, the wealthiest segment, is associated with significantly higher historical and current CO2 footprints. It is, therefore, imperative for high earners to make concerted efforts to reduce emissions and adopt a sustainable, low-carbon lifestyle immediately. The focus should be on responsible consumption while making sustainability aspirational for all. This will ensure that as incomes rise in the future, sustainability is aspired to and achieved. These individual efforts and choices can collectively shape carbon footprints and free up carbon space.
Sustainable living encompasses various practices and conscious choices. It should include practices such as installing energy-efficient appliances in homes and offices, switching off appliances when not in use, increasing the set temperature in air conditioners for appropriate thermal comfort, and using natural daylight. Furthermore, embracing measures such as the use of public transport and carpooling can significantly decrease emissions related to personal commuting. Emissions that cannot be avoided can be offset by supporting carbon offset programmes. Further, by shifting to low-carbon products and technologies, individuals can create demand that can incentivise businesses to develop and provide sustainable alternatives. This, in turn, accelerates the transition to a net-zero carbon economy. The adoption of practices such as these aligns well with India’s Lifestyle for Environment (LiFE) mission, which emphasises responsible consumption in harmony with nature. In this context, high-income earners, particularly in developed countries, must act promptly to ensure climate justice and collectively embrace low-carbon lifestyles for a fair and sustainable future.
Rising CO2 emissions worldwide are responsible for increasing climate impacts, such as droughts, floods, cyclones, wildfires, and other extreme events (IPCC 2021). Traditionally, economic growth has improved living standards in many nations, but it has also led to higher CO2 emissions and the depletion of natural resources (Adom et al. 2012). As we are still largely dependent on fossil fuels for our energy needs, higher economic activity leads to higher energy use, consequently increasing emissions. In 2021, global CO2 emissions linked to energy consumption witnessed a notable increase of 6 per cent, reaching a record high of 36.3 billion tonnes. This rise can be attributed to the robust recovery of the world economy following the COVID-19 crisis, along with a heavy reliance on coal (IEA 2022).
While carbon emissions are a consequence of economic activities, these are not evenly distributed among the world population. This inequity in emissions exists across multiple levels, including the historical and current emissions of countries, as well as per capita emissions. To illustrate, in 2020, per capita CO2 emissions in Saudi Arabia and the United States were 14.2 and 13 metric tonnes, while the per capita emissions of Brazil and India were only 1.94 and 1.57 metric tonnes, respectively (World Bank n.d. (b)).
Moreover, of the cumulative 2,450 billion metric tonnes of carbon emitted during 1850–2019, North America and Europe accounted for 27 and 22 per cent, respectively. On the other hand, South and Southeast Asia accounted for 9 per cent, Latin America for 6 per cent, MENA for 6 per cent, and Sub-Saharan Africa for 4 per cent (Chancel et al. 2022). More specifically, in this period, the US and Europe emitted a cumulative 400 and 348 gigatonnes (Gt) of CO2 , respectively. In comparison, developing countries such as India and Brazil contributed approximately 53 and 15 Gt CO2 , respectively (Malyan 2021).
An Intergovernmental Panel on Climate Change (IPCC) report indicates that from 2020, only 500 Gt of CO2 will remain in the carbon budget to limit warming to 1.5 degrees with a 50 per cent probability (IPCC 2022). With a shrinking carbon budget, the current global climate discourse revolves around equity and Common but Differentiated Responsibilities and Respective Capabilities (CBDR-RC), as Article 3 of the United Nations Framework Convention on Climate Change (UNFCCC) notes. At the annual Conference of Parties (COP), this has become a pressing issue.
Beyond the country-wise inequities in emissions, there is also a correlation between per capita emissions and income. Globally, the top 10 per cent of emitters were responsible for almost half of the energy-related CO2 emissions in 2021, while the lowest 10 per cent contributed a minimal 0.2 per cent (Cozzi, Chen, and Kim 2023). This indicates the stark contrast between the emission footprints of the affluent versus the less privileged, raising critical questions about environmental justice and shared responsibility at the national and international levels.
From 1990 to 2015, consumption-driven CO2 emissions increased by approximately 60 per cent, and half of this growth can be attributed to the world’s richest 10 per cent (Kartha et al. 2020). It is crucial to recognise that the affluent, particularly in developed nations, have significantly contributed to global carbon emissions. While the top 10 per cent of emitters are distributed across various global regions, approximately 85 per cent of them are from developed nations, such as the US, UK, Australia, Japan, Canada, Korea, the EU, and China (Cozzi, Chen, and Kim 2023). Further, an analysis of the investment portfolios of the 125 most affluent billionaires worldwide revealed that, on average, they emit a million times more than an average individual in the bottom 90 per cent of the population (Maitland et al. 2022). Notably, only 1 per cent of the world’s population is responsible for half of the emissions generated by flying (Gössling and Humpe 2020). Therefore, the distribution of emissions becomes critical both within and between countries.
In this study, we focus on consumption-driven emissions and how energy-intensive lifestyles and resource usage have propelled emissions to alarming levels in recent years, especially among the rich. We also unpack the various levels of inequity that exist across selected countries and their far-reaching implications for sustainability and equity. We also examine the carbon budget–saving that becomes possible if top emitters adopt low-carbon lifestyles.
We followed a four-step approach to understand the level of inequity in emissions, emission intensities, and estimate carbon budget savings, as noted in Figure 1. We selected specific countries, collected emissions data, estimated indicators, and derived key insights on the existing state of inequity.
Figure 1 Methodology
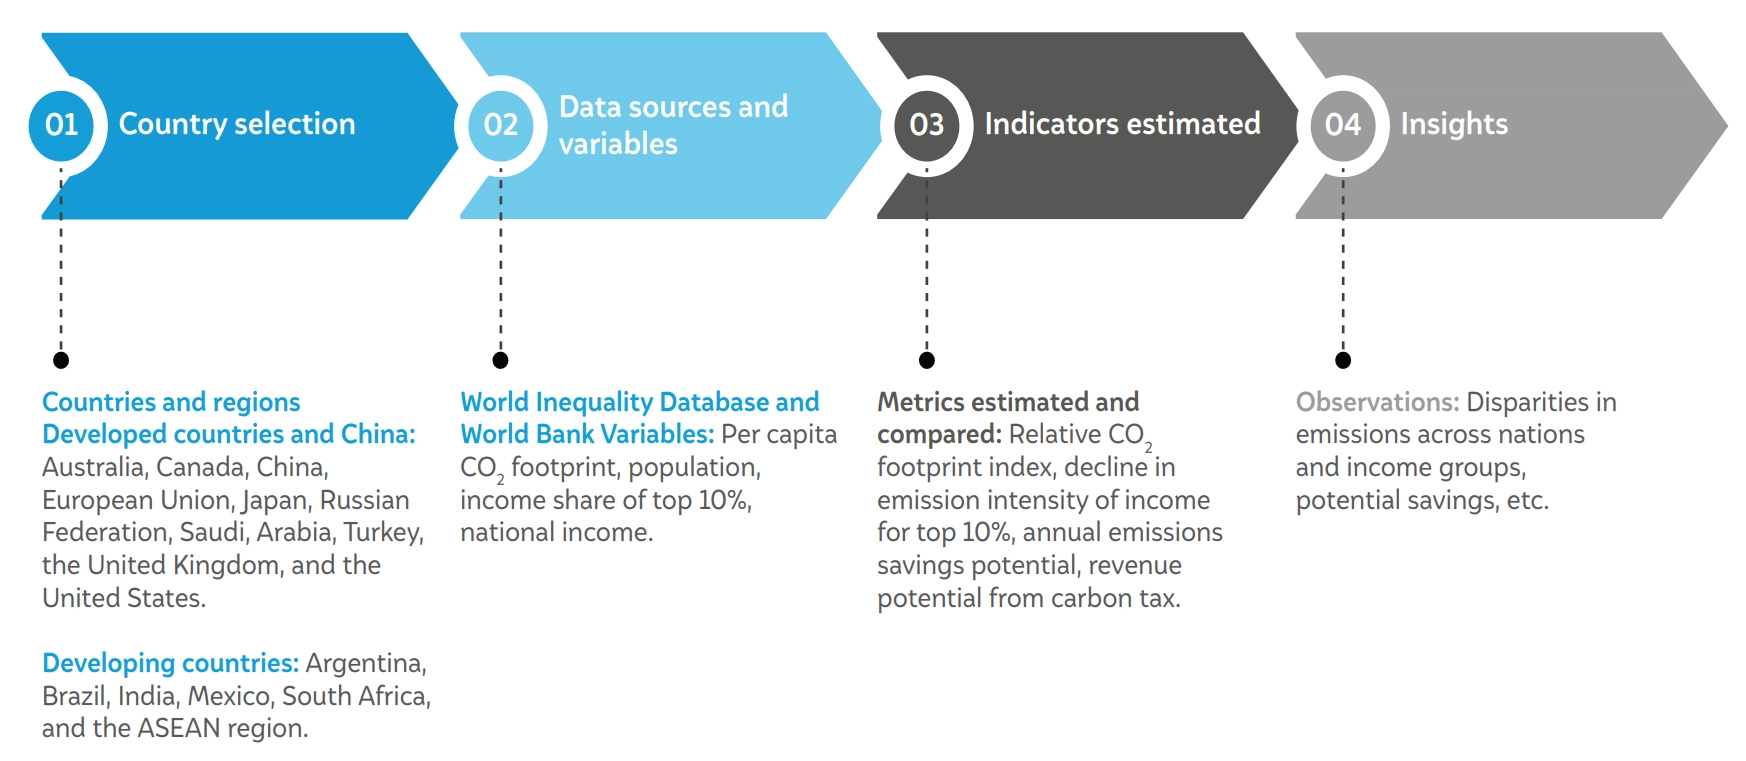
Source: Authors’ compilation
For this study, we considered a diverse set of developed and developing economies and regions. This included Argentina, the Association of Southeast Asian Nations (ASEAN),2 Australia, Brazil, Canada, China, the European Union (EU),3 India, Japan, Mexico, the Russian Federation, Saudi Arabia, South Africa, Turkey, the United Kingdom (UK), and the United States (US). For ASEAN and the EU, we estimated the CO2 footprint and other variables by calculating population-weighted averages.
These major economies, taken together, represent approximately 81 per cent of global emissions, 86 per cent of the world’s gross domestic product (GDP), and 66 per cent of the global population (World Bank n.d. (a)). Hence, capturing a broad spectrum of global emission dynamics and developmental contexts.
We collected per capita CO2 emissions data for various income segments, such as the top 1 per cent, top 10 per cent, and bottom 10 per cent in the selected countries from the World Inequality Database (WID), which offers comprehensive and comparable information on global income and wealth distribution evolution along with carbon-related variables at the national and individual levels. Details relating to the WID methodology, estimation concepts, measurement units, and conversion methods are available in the Distributional National Accounts Guidelines document (World Inequality Lab 2021).
We also obtained the income share of the top 10 per cent from the Poverty and Inequality Platform (PIP), which provides access to the World Bank’s poverty, inequality, and shared prosperity estimates for over 160 economies. These estimates are based on household survey data. Additionally, we also used national income data for the selected countries from the World Bank Database.
We compared the stark disparities between the CO2 emissions of different income groups, specifically between the rich (top 10 per cent) and richest (top 1 per cent) across these countries. The key indicators that we used included the following:
Additionally, given that our focus was the carbon footprint of individuals, the per capita emissions we considered follow consumption-based accounting, 4 The most recent data on CO2 footprints across income segments was for 2019. We used income data for the same year to maintain consistency. unlike territorial emissions, which include emissions generated within the geographical borders of a country or region (calculated using production-based accounting). Consumption-based CO2 emissions allow us to factor in the carbon embedded in the goods and services that are exported and imported; this offers a better estimate of the CO2 emissions generated by consumption and the resources used and can be illustrative of lifestyles and consumption patterns.
Our analysis aimed to capture key insights, which included the following: variability in emissions between the richest (the top 1 per cent) and the rich (the top 10 per cent) in different economies in per capita terms; intra-country inequities between the emissions of the top 10 per cent and the poorest decile; the decline in the emission intensity of the income of the richest decile over the period 2008–2018; the emission savings possible if the top 10 per cent of the population were to reduce their per capita emissions; and the revenue that can be generated if the emissions of the top 10 per cent are taxed. Table 1 provides a detailed explanation of the steps we followed to arrive at the insights presented in Section 3.
Table 1 Indicators used and estimated
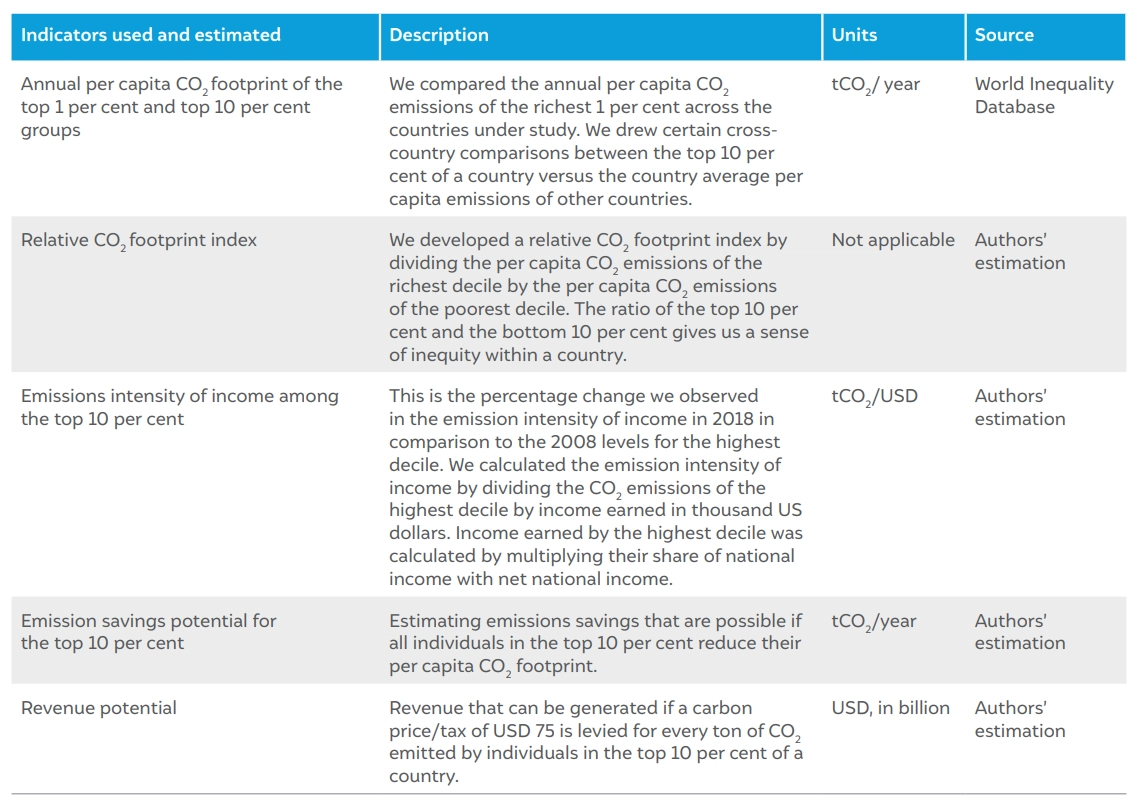
Source: Authors’ compilation
In this section, we present the key takeaways from analysing emissions across various income groups in developed and developing nations. We look at these disparities from multiple dimensions and arrive at the potential for emission savings that could be achieved by incentivising sustainable lifestyles.
We adopted a multifaceted approach to understanding the carbon footprints of high-income groups. We looked at the emission levels of the top 1 per cent and top 10 per cent income groups and compared these figures across a set of developed5 and developing countries. This comprehensive perspective allowed us to understand how top-earning individuals contribute to emissions across countries due to their consumption patterns.
The richest in the developed world have a disproportionate impact on emissions
There are wide-ranging differences in the amount of CO2 emissions generated by the top-earning populations across different countries, which can be attributed to varying consumption patterns. At one end of the spectrum, high emitters, an individual from the top 1 per cent income group in the US had an annual per capita CO2 footprint of 228.6 tCO2 , and an individual from the same category in Australia and Saudi Arabia had footprints of 197.9 and 182.1 tCO2 /year, respectively (see Figure 2).
Similarly, individuals from the richest 1 per cent category in Canada, Russia, and China had a CO2 footprint above 100 tCO2 /year in 2019. On the other hand, the top 1 per cent of nations like Japan, Mexico, the UK, South Africa, the EU, and Turkey were moderate emitters, with an annual per capita CO2 footprint in the range of 60–85 tCO2 in 2019.
Figure 2 Annual per capita CO2 footprint of the top 1% (in tCO2 )
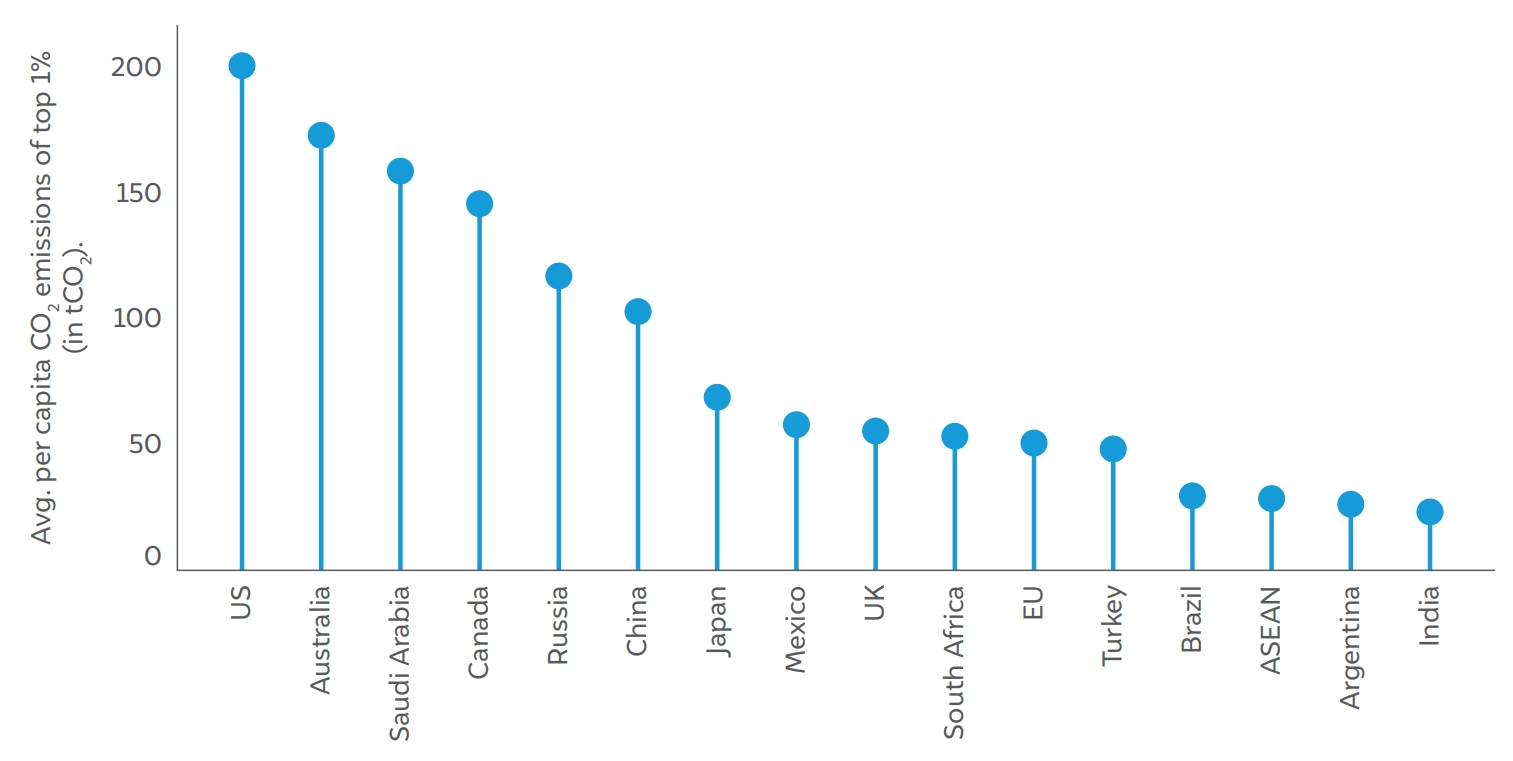
Source: Authors’ compilation
At the other end of the scale, the average per capita CO2 emissions of the richest 1 per cent in developing countries such as India (with the lowest footprint among these countries at 31.7 tCO2 ), Argentina (34.6 tCO2 ), Brazil (38.8 tCO2 ), and the ASEAN region (37.6 tCO2 ) were significantly low and equivalent to approximately one-sixth of the per capita CO2 emissions of the top 1 per cent of the US. This demonstrates the varying levels of emissions among the affluent segments of different countries, highlighting both economic and regional disparities.
The top 10% in developing nations emit less than the national average of developed nations
We further compared the per capita CO2 footprints of the richest 10 per cent of developing and developed countries to average per capita CO2 emissions to gain a more detailed understanding of the disparities in CO2 footprints across countries (Figure ES1).
In 2019, an individual in the richest 10 per cent of India had a CO2 footprint of 7.4 tCO2 , which was less than that of an average-earning individual from developed countries such as Saudi Arabia, the US, Canada, Australia and Japan. Illustratively, an individual from among India’s richest 10 per cent emits less than half the emission of an average Saudi Arabian resident.
Similarly, in other developing countries in the ASEAN region, Argentina, or Brazil, an individual in the richest 10 per cent emits less than or equal to an average-earning individual in Saudi Arabia, the US, Australia, Japan, and Canada. More specifically, in 2019, an individual in the top 10 per cent of Argentina had a CO2 footprint of around 9.7 t CO2 , emitting 38 to 65 per cent less than an average earner in developed countries like the US, Saudi Arabia, and Australia. Also, an individual in the top 10 per cent segment in Mexico had a similar CO2 footprint when compared to Australia’s average.
Our analysis, therefore, suggests that the wealthiest 10 per cent in developing countries emits either lesser or nearly equivalent amount of emissions as the per capita average of developed nations.
The top income classes in developing countries emit the same amount of CO2 as the bottom income segments in developed nations
It is crucial to compare CO2 emissions of the 10 income categories in these countries to understand the carbon disparities among nations and income groups (Figure 3).
It was found that the per capita CO2 emissions of the top 10 per cent were highest in Saudi Arabia and the US, where an individual in the top 10 per cent category emitted over 50 tonnes of CO2 annually. In contrast, the per capita CO2 emissions of individuals in the same category in developing countries (except South Africa) were four to eight times lower.
Moreover, the per capita CO2 emissions of individuals in the richest 10 per cent category in certain developed countries – such as the EU, Turkey, and the UK – were less than half of those of individuals in the top 10 per cent in Saudi Arabia and the US.
Interestingly, individuals in the top 10 per cent category in developing countries (except for Mexico and South Africa) emit nearly the same amount as individuals in the fourth- and third- (or even second-, in some cases) lowest deciles in developed nations, including Australia, Canada, the US, and Saudi Arabia. As we move down the income spectrum, these inequalities become starker. For instance, an individual in the poorest 10 per cent of Saudi Arabia, the US, or Australia produced 10–15 times more emissions than an individual in the poorest decile in India.
Figure 3 The rich in India, Brazil emit less than the lower-income classes in US, Saudi Arabia.
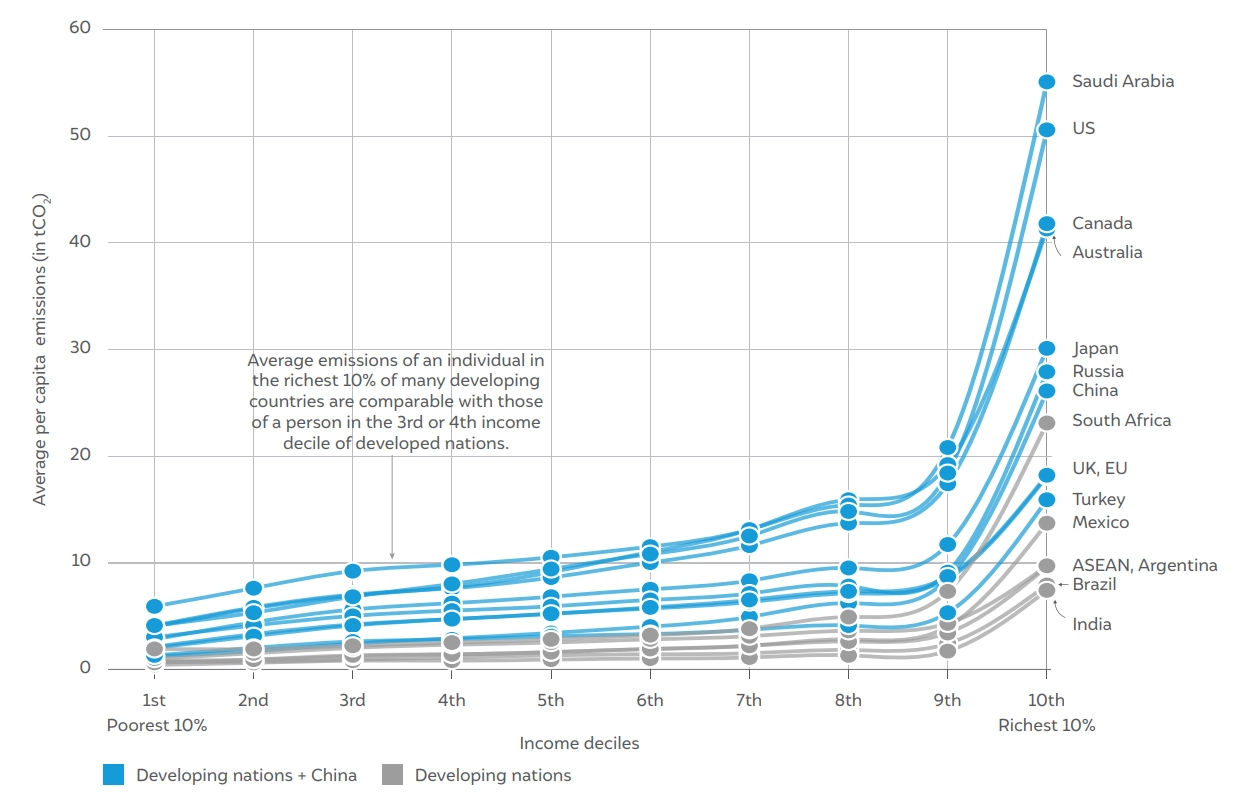
Source: Authors’ compilation
Further, when analysing per capita CO2 emissions across income spectrums in these nations, a noticeable pattern emerges. The highest decile’s per capita CO2 footprint is 2-5 times greater than the second-highest income segment across different countries. In summary, the top 10 per cent exhibits substantially higher per capita emissions compared to the remaining nine income classes in the pyramid. This underscores the substantial impact of high-emitting groups on carbon emissions.
Moreover, in 2019, the top 10 per cent in developed nations and China collectively emitted over 6.8 billion tonnes of CO2 . To put it in perspective, there are approximately 225 million individuals in the top 10 per cent decile in developed nations and China and they have emitted 22 per cent more than 2.4 billion people living in the selected developing countries in 2019.
In short, there are noticeable disparities in CO2 footprints among all income groups across developed and developing countries. While disparities exist between the richest segments across countries, the contrast is even more striking when comparing the carbon footprint of lower-income groups in different countries.
While the top 1 per cent and the 10 per cent of developed nations contribute significantly to emissions, it is equally imperative to consider the broader issue of emission disparities within each of the selected countries by analysing the differences in emissions between the highest and lowest earning deciles within a country. Figure 4 reveals the level of intra-country inequity in terms of per capita CO2 emissions in the year 2019. Building on the methodology discussed in Section 2, we used the concept of a relative CO2 footprint index. We derived this index by dividing the per capita CO2 footprint of the top 10 per cent income group by that of the poorest decile (or bottom 10 per cent). A higher value of this index signifies a more pronounced disparity within the country.
Figure 4 Relative CO2 footprint index of top vs bottom income decile across countries
Source: Authors’ analysis
Of the selected countries, high levels of intra-country emissions inequity were observed in China. For example, an individual within the top 10 per cent income class in China emitted over 21 times the amount of CO2 produced by an individual in the poorest decile (bottom 10 per cent).
However, in countries such as the US, Brazil, and South Africa, an individual in the top 10 per cent income group emitted approximately 12 times more CO2 than an individual in the bottom 10 per cent. Interestingly, Argentina’s relative footprint index was just 9.6, indicating a lower level of inequity than certain developed nations, such as Australia, Canada, Turkey, and Japan.
High and varied patterns of inequity in per capita CO2 emissions exist within developed and developing economies, with levels of inequity varying based on the specific economic circumstances of each country.
We analysed the decline in emission intensity for the highest decile (top 10 per cent) within each selected country. As outlined in Section 2, we calculated this decline for the period 2008–2018; Figure 5 illustrates the decline achieved in 10 years.
Our analysis revealed that the top earning decile in China and the US achieved substantial declines in the emission intensity of their incomes – approximately 35 to 40 per cent. This reflects the levels of efficiency that these countries have attained in manufacturing consumption goods, which are driven by the availability of advanced technologies. It is important to note that these results rely on consumption-based estimations, suggesting that the decline in emission intensity might have also stemmed from efficiency improvements in production beyond domestic boundaries. Further, shifts in consumption patterns and country-specific policies aimed at promoting sustainable practices are additional factors that could have contributed to the varying rates of decline in emission intensity across countries.
During the same period, Argentina’s top 10 per cent also saw a significant decline (33.4 per cent) in the emission intensity of their income. Similarly, the richest decile in, the EU, South Africa, the UK, India, Japan, and Mexico witnessed a reduction of approximately 15–20 per cent for every USD 1000 they earned since 2008. Moreover, an individual in the top 10 per cent group in developing countries including Argentina, India, South Africa, and Mexico have witnessed a greater decline in emissions intensity of income earned in comparison to an individual in the highest decile of certain developed nations such as Japan, Australia, and Canada.
In contrast, Russia, Turkey, and Brazil witnessed an increase in emission intensity between 2008 and 2018. This meant that for every USD 1,000 they earned, an individual in the top 10 per cent group emitted approximately 5 per cent more in 2018 than in 2008.
Additionally, it is important to note that even though emissions per thousand dollars of income earned decreased between 2008 and 2018, the overall emissions have increased due to a rise in income levels. This emphasises the urgent need for the richest individuals worldwide to work collectively towards lowering their CO2 footprints in order to play a pivotal role in combating climate change.
The top 10 per cent in any country emits about 3-5 times more CO2 than their national average (in per capita terms). However, if these top earners were to reduce their emissions, a substantial amount of carbon emissions could be mitigated. Even if individuals within the top 10 per cent of income earners in developed countries and China were to reduce their emissions by 50 per cent, they would free up more than 3.4 billion t CO2 of carbon space annually based on 2019 data. Yet, they would still emit 1.5 to 2.5 times more than their national average per capita emissions. The saved carbon space could then be made available for lower-income groups, especially in developing countries, allowing them to progress towards a better quality of life without adding to the total quantity of emissions.
Figure 5 Top 10% saw decline in emissions intensity of income but overall emissions rose due to income growth
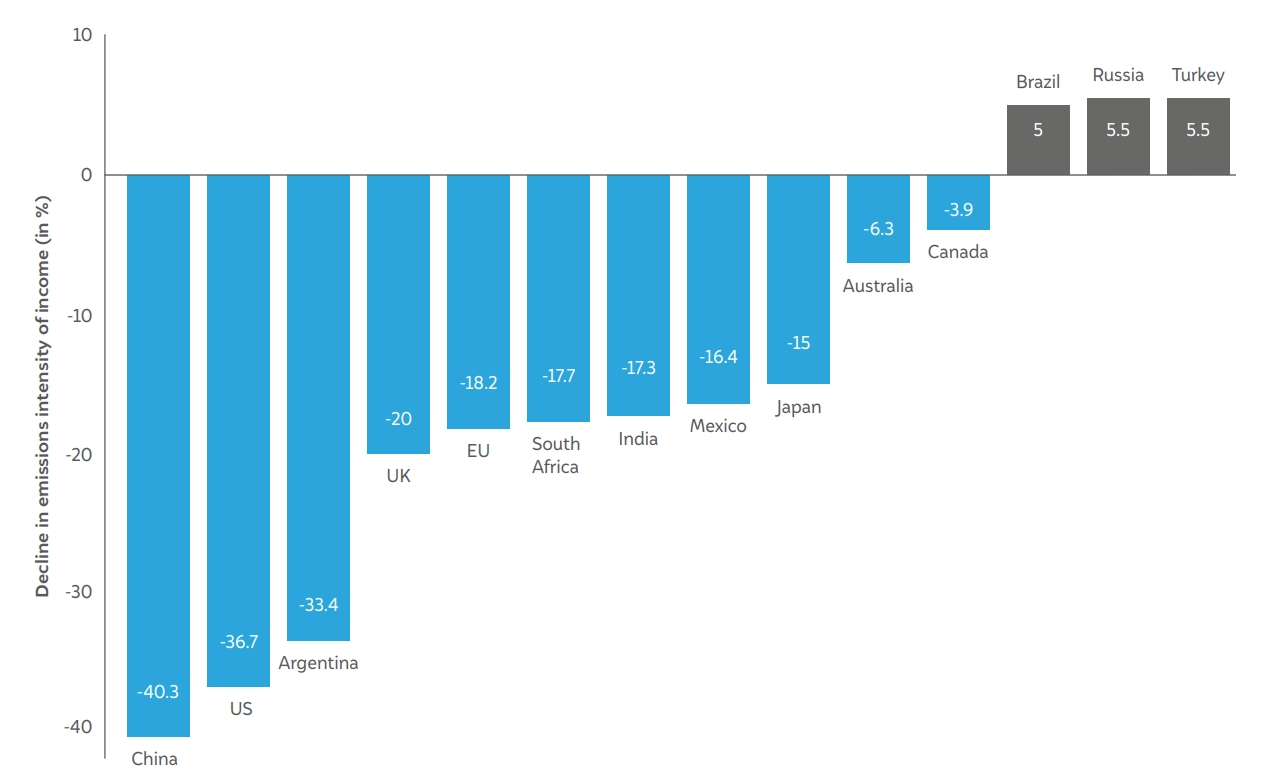
Source: Authors’ analysis
For example, a person in the top 10 per cent decile in Australia emitted 41.3 t CO2 /year in 2019. If they reduced their emissions by 50 per cent, we would see substantial emission savings of approximately 20.6 t CO2 per individual within the top 10 per cent class – that is, around 52.4 million tonnes of saving, considering that there are more than 2.53 million people in the higher (top 10 per cent) income bracket in Australia.
While both the US and Saudi Arabia exhibit a similar per capita emission savings potential of around 25 – 28 t CO2 /year, the larger population size of the United States translates into a more significant absolute potential for savings for approximately 830 million t CO2 annually compared to 98.7 million t CO2 , for Saudi Arabia as Figure ES2 illustrates. Following suit, the richest 10 per cent in other developed countries, including Australia, Canada, and Japan, also have considerable emission savings potential, each adding more than 15 t CO2 in annual savings per capita. China’s top 10 per cent could save over 1.8 billion t CO2 annually, averaging about 13 t CO2 per capita.
The emission savings is around 60 per cent of the total CO2 emissions of all the developing countries/regions we analysed in this study in 2019, which includes Argentina, Brazil, India, South Africa, Mexico, and ASEAN members.
Thus, proactive efforts by the top income earners in developed countries could carve out more carbon space. This would allow the bottom strata an additional developmental carbon budget to meet their aspirations without adding more CO2 into the atmosphere.
Figure 6 Carbon tax on the top 10% in developed nations and China could yield over USD 500 billion
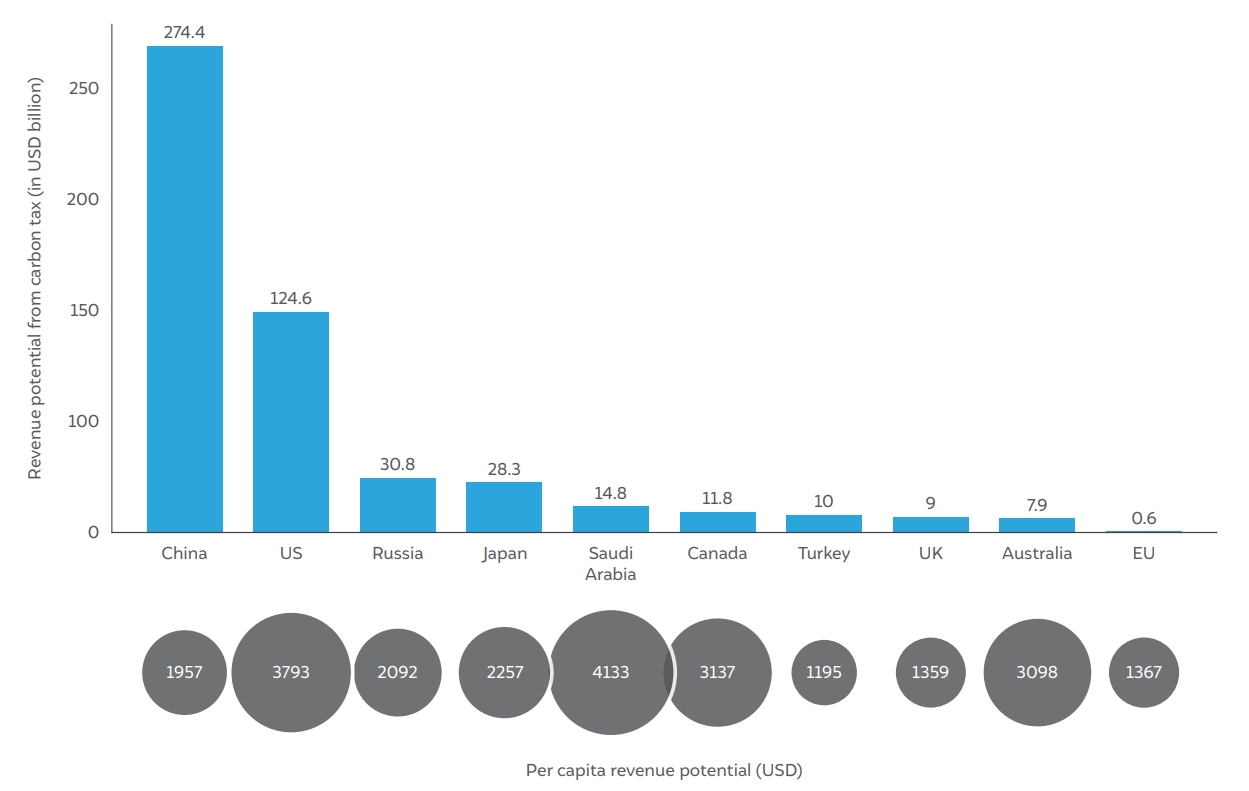
Source: Authors’ analysis
Incentivising the richest decile to adopt low-carbon lifestyle requires a multifaceted approach that combines economic, social, and behavioural strategies. One such strategy could be implementing a carbon tax that is levied on every ton of CO2 emitted by those in this category.
Figure 6 demonstrates the potential revenue from implementing a carbon tax on the emissions of the top 10 per cent of income earners. As discussed in Section 2, the revenue calculation for each country is based on the assumption of a carbon tax of USD 75 per ton of CO2 emitted by the top 10 per cent. This tax rate aligns with recommendations that a global carbon price of USD 75 per ton is required to effectively curb emissions and keep global warming below 2°C (Parry 2021).
If a carbon tax is applied to China’s top 10 per cent, it could yield an estimated annual revenue of USD 274 billion annually (based on 2019 data). If this was considered on a per capita basis, each individual in China’s richest decile would contribute more than USD 1,900 in revenue. Consequently, the cumulative revenue generated from taxing China’s top 10 per cent group is quite substantial due to its large population.
In developed countries such as Australia, Canada, Saudi Arabia, and the US, the per capita revenue potential from implementing a carbon tax can be as high as USD 3,000–4,200. However, due to their relatively smaller population sizes, the total revenue potential from these countries’ top 10 per cent earners is less.
Of particular interest is the fact that the implementation of a carbon tax on the emissions of the richest 10 per cent in developed nations, including China, has the potential to generate USD 512 billion annually, which is 1.7 times the estimated international adaptation finance needed for developing economies (UNEP 2022). This substantial revenue could be channelled towards research and development, de-risking investments in clean technology, and building climate resilience.
Taxing individuals with a higher CO2 footprint aligns with the ‘polluter pays’ principle, which advocates for internalising environmental costs. This principle asserts that those responsible for pollution should bear the associated costs rather than transfer them. In practice, it means that individuals or entities emitting CO2 pay a tax that directly corresponds to the volume of emissions they produce. This approach promotes responsible environmental behaviour and ensures that those who contribute more to carbon emissions also contribute proportionally to efforts to mitigate climate change (UN 2021).
Our findings provide crucial insights into the intricate relationship between income levels, carbon emissions, and their broader implications for developed and developing economies. The per capita carbon footprint of the richest 1 per cent of the population worldwide increased from 87 tCO2 e in 1990 to 110 tCO2 e in 2019. In contrast, the per capita carbon (including other GHGs with CO2 ) footprint of the bottom 50 per cent group increased marginally from 1.2 tCO2 e in 1990 to 1.6 tCO2 e in 2019 (Chancel et al. 2022).
We found that the per capita CO2 footprint is significantly greater – sometimes even four to eight times higher – among the top 10 per cent income group in developed nations than their counterparts in developing nations. Even more significant is our finding that the most affluent – the richest 1 per cent of the population – in developed economies (including China) have a per capita CO2 footprint considerably greater than the top 1 per cent in developing countries. The disparities are so pronounced that the per capita CO2 footprint of the top 10 per cent group in developing countries is actually lower than the average per capita emissions in the developed world. This highlights the substantial contribution of the top earners in developed nations to overall carbon emissions.
The data showcases substantial differences in per capita CO2 emissions among various income groups and countries. While the top 1 per cent and the top 10 per cent in developed nations often emit higher levels of CO2 due to their consumption patterns, it is equally essential to consider the broader context of income disparities within countries. Mitigation policies should be formulated to ensure that they do not amplify existing disparities and do not disproportionately impact the lower-income strata. This approach is vital for achieving an equitable transition to a low-carbon economy (Guivarch, Taconet, and Mejean 2021).
Furthermore, the reduction in emission intensity of income in the top 10 per cent income group offers a nuanced perspective on how the CO2 footprint of this affluent segment has changed between 2008 and 2018 in relation to their income levels across different countries. With a few specific exceptions, it is evident that overall, the top-earning individuals in all countries experienced a decline in emission intensity over this time frame. However, this decline varies due to the diverse levels of technological advancement in the manufacturing process, shifts in consumption patterns, and the effectiveness of policy implementation across different countries.
This reduction in emission intensity signifies a positive trend, indicating that in 2018, for every USD 1,000 of income earned, there was a decrease in the associated carbon emissions compared to 2008. Nonetheless, we must recognise that even with this decline, the absolute CO2 emissions produced by the top 10 per cent income group remain significantly high. Therefore, we need concerted efforts to reduce emissions by this high-emitting group by promoting a broader shift towards a sustainable, low-carbon lifestyle.
Personal choices are pivotal in this transformation, collectively influencing our carbon footprints. A sustainable lifestyle entails a range of practices, from installing energy-efficient appliances to minimising energy usage to adopting electric or hybrid vehicles. Moreover, opting for public transportation or carpooling significantly lowers emissions associated with daily commuting. Individuals can also offset emissions from air travel by supporting programs that finance environmental initiatives. Embracing choices, such as reducing the use of single-use plastics, prioritising locally-sourced products, and conserving water and energy in daily routines, holds the potential for substantial reductions in emissions.
Although personal choices and consumption patterns influence individual carbon footprint, it is also significantly impacted by industrial activity and government policies. To substantially reduce carbon footprints, low-carbon infrastructure within the economy, including energy-efficient systems and sustainable practices, is essential.
The potential for emission savings becomes substantial when the top 10 per cent income group chooses to lower their carbon footprint. Encouraging the adoption of less carbon-intensive consumption patterns among the top 10 per cent of individuals in developed countries along with China alone, could result in a remarkable annual reduction of over 3.4 billion tonnes of CO2 . This action effectively opens up essential carbon capacity for lower-income groups.
The top 10 per cent of the population in developed countries, often recognised as the wealthiest segment, is associated with notably higher historical and current CO2 footprints than the rest of the population. It is crucial to note that advocating for emissions reduction does not imply advocating for a reduction in consumption. Instead, the emphasis is on endorsing responsible consumption practices, making sustainability aspirational. Achieving this goal can be realised by embracing low-carbon alternatives, such as electric cars and energy-efficient appliances.
The resources and financial capacity of the top 10 per cent in developed nations position them to play a vital role in this transition. They can not only reduce their own carbon footprints but also drive change at a larger scale. By shifting to low-carbon products and technologies, they create a demand that can incentivize businesses to develop and provide sustainable alternatives. This, in turn, accelerates the transition to a net-zero carbon economy. This collective endeavour is indispensable for effectively addressing climate change and ensuring an equitable and sustainable future for all.
Implementing a carbon tax on the richest provides a means to fund sustainable initiatives while discouraging carbon-intensive consumption patterns. Implementing a carbon tax on per capita emissions involves categorising emissions based on underlying consumption activities, differentiating between necessities like food and shelter and emissions related to income generation (e.g., commuting to work), and luxury consumption (such as business-class travel). The tax can be applied on a per capita basis for the top 10 per cent, with variable tax rates for different consumption categories. For instance, higher taxes could be applied to luxury consumption, such as business-class flying or private jets. Further, it is crucial to ensure that the tax does not indirectly burden lower-income groups.
Moreover, implementing a carbon tax on the wealthy may have certain complexities and implications.
For instance, high-income individuals, with their financial capacity, might continue emitting at similar levels. Additionally, individuals may have an inelastic demand for carbon-intensive goods and services. Furthermore, the administrative aspects of implementing a tax explicitly targeting a single income group can be complex, requiring additional infrastructure for tracking and collecting taxes. Addressing these challenges necessitates a well-thought-out policy design that carefully considers both its environmental and socioeconomic impacts (Benoit 2020).
In conclusion, addressing emissions disparities is a multifaceted challenge beyond reducing carbon footprints. It is about the equitable distribution of responsibilities and requires an integrated approach involving sustainable consumption, cleaner technologies, support for low-income households, and global climate action. It is evident that the top-earning segments of societies, especially in developed countries, must address emissions issues urgently to ensure climate justice.
Mission LiFE (Lifestyle for Environment), introduced by India at COP26 in November 2021, aims to create a worldwide community of individuals known as Pro-Planet People (P3), united by a shared dedication to embracing and advocating eco-friendly lifestyles. It calls for responsible consumption, emphasising lifestyle changes that minimise harm to the environment. The emissions disparities between income groups and the potential for emission reductions highlight the importance of LiFE’s focus on sustainable living. In line with this, the UNEP stresses that global carbon emissions could reduce by approximately 20 per cent if one billion individuals out of the global population of eight billion adopt eco-friendly habits (MoEFCC, NITI Aayog 2022). By encouraging individuals and communities to adopt practices that align with conservation and moderation, LiFE contributes to the broader goals of addressing climate change and promoting equitable, low-carbon lifestyles.
Carbon footprint represents the total amount of greenhouse gases (GHGs) in tonnes of CO2, both directly and indirectly emitted, to sustain an individual's lifestyle, organizational activities, product manufacturing, or events within a specified timeframe, typically a year.
Territorial emissions, also known as production-based emissions, refer to the emissions physically released within a specific geographic area, typically a country's borders. In contrast, consumption-based emissions account for the total emissions embedded in the consumption of goods and services, irrespective of where the production emissions occurred. The difference between territorial and consumption-based emissions lies in the scope of accounting for emissions. Consumption-based CO2 emissions allow us to factor in the carbon embedded in goods and services that are exported and imported for consumption and can be illustrative of lifestyle and consumption patterns.
Rapid economic growth, as indicated by high GDP, leads to increased industrial activity and energy consumption. Given that most of our energy demands are met by fossils, high GDP typically leads to higher emissions. However, the nature of economic activities matters; a shift towards cleaner technologies and more sustainable resource use can decouple GDP growth from a substantial rise in emissions. The impact of income inequality on CO2 emissions is nuanced and contingent on specific country circumstances. The relationship is influenced by factors such as the level of economic growth, policies, and societal structures. Similarly, climate change induced by rising CO2 emissions, may disproportionately impact poorer segments, thereby intensifying existing disparities.
Per capita emissions represent the amount of emissions generated on account of an individual's activities and consumption patterns. Inequity in per capita emissions refers to the uneven distribution of greenhouse gas emissions among individuals in different regions or countries. The variation in per capita emissions between countries stems from factors such as varying levels of industrialization, economic development, energy consumption patterns, and resource accessibility. Developed countries often experience higher per capita emissions due to industrial activities and higher standards of living, while developing nations may have lower per capita emissions.
The Common But Differentiated Responsibilities and Respective Capabilities (CBDR-RC) principle, as articulated in Article 3 of the United Nations Framework Convention on Climate Change (UNFCCC), recognizes that countries have varying duties and capacities to address the impacts of climate change. This principle emphasizes on equity, recognizing that developed nations bear a greater responsibility and should take the leading role in the efforts to combat climate change. Additionally, the CBDR-RC principle underscores the importance of considering the specific needs and unique circumstances of developing countries, particularly those vulnerable to the adverse effects of climate change.
Tamil Nadu’s Greenhouse Gas Inventory and Pathways for Net-Zero Transition
Implications of an Emissions Trading Scheme for India’s Net-zero Strategy
Demystifying Carbon Emission Trading System through Simulation Workshops in India
Assessment of the G20 Members’ Long-Term Strategies