Council on Energy, Environment and Water Integrated | International | Independent
Suggested Citation: Dhandapani, Sairam, Priyanka Singh, Satyateja Subbarao, and K.S. Jayachandran. 2024. Catalysing Local Action for Clean Air: A Guidebook to Map Hyperlocal Sources of Air Pollution. New Delhi: Council on Energy, Environment and Water.
This study proposes a complementing approach to existing scientific studies in generating hyperlocal information on the causes of pollution in a city. The methodology has been developed and refined in close consultation and coordination with DoE (Department of Environment, (GNCTD)), Delhi. With a dedicated field team and geographic information system (GIS) tools, the study analyses data from a system created to catalogue 17 distinct dispersed pollution sources at the hyperlocal level.
Updating pollution source information in cities is challenging due to resource constraints, expertise, and time for source apportionment and emission inventory studies. As of December 2022, only 30 per cent of the 131 non-attainment cities had completed a source apportionment/ emission inventory study.
The study has also developed a custom indicator, Composite Ward Score (CWS), that supports municipalities in identifying and managing pollution hotspots for effective mitigation efforts and overcoming resource constraints faced by Urban Local Bodies (ULBs).
As a comprehensive long-term measure of pollution control in Indian cities, the Ministry of Environment, Forests, and Climate Change (MoEF&CC) introduced the National Clean Air Programme (NCAP) as a national strategy to tackle air pollution in 2019. As part of NCAP, the country’s most polluted cities, known as non-attainment cities (NACs), were identified. City-specific strategies were to be devised for reducing pollution levels in these cities. To strengthen its commitment towards tackling air pollution, the Government of India included a budget outlay for air quality management in urban local bodies (ULBs) in the union budgets for 2020 and 2021. The State Pollution Control Boards (SPCBs) created city-specific action plans for each of the NACs by incorporating a series of measures to improve air quality. The utilisation of only 26 per cent of the allocated funds for clean air plans in 89 non-attainment and 42 million-plus cities as of March 2022 points a need for improvement in the implementation of city-specific action plans (Lok Sabha XVII/Question882/2022).
ULBs are grappling with lack of actionable data, which is one of the causes of their inaction. A city-level source apportionment study is needed to target primary polluting sources of the city. But less than 30 per cent of NACs have completed source apportionment studies under NCAP (Prana Portal, n.d.). Even a complete source apportionment study is insufficient, as it only provides contribution from sectoral sources and not detailed data on local causal sources and activities that cause pollution. Therefore, cities need to explore ways to generate high-quality pollution source information periodically and quickly
This report proposes a methodology for generating novel insights based on hyperlocal information on the causes of pollution within a city. Notably, the foundation of this approach stems from the launch of the Green Delhi app in October 2020. With an intent to mitigate air pollution at the local level, Delhi govt. urged the citizens to upload air pollution-specific complaints using geo-tagged pictures and videos on the Green Delhi app, thereby crowd-sourcing data on dispersed sources of air pollution, engaging citizens in a participatory mode and resolving them through a round-theclock ‘Green War Room’ coordinating time-bound resolution with stakeholder departments and agencies within prescribed timelines. Following this, certain other elements of the approach, such as route planning and app-based identification of dispersed sources, have been introduced and implemented by the Air Pollution Action Group (A-PAG), as part of their dispersed source programme in multiple cities across four states. A process to address dispersed sources was piloted successfully by A-PAG under the guidance of The Commission for Air Quality Management (CAQM) in National Capital Region and Adjoining Areas with South Delhi Municipal Corporation (SDMC) in 2021. The methodology outlined in this study represents an enhancement of the existing approach, developed in close collaboration and coordination with the Department of Environment (DoE) under the Government of the National Capital Territory of Delhi (GNCTD). This approach entails identifying, mapping, and addressing hyperlocal dispersed sources of pollution comprehensively. The report aims to provide a template for other cities to emulate. Hence, the report exclusively focuses on the scientific approach and methodology and does not include any primary data generated during the study. With a dedicated field team and geographic information system (GIS) tools, we have created a system to catalogue dispersed pollution sources at the ward level. Our interactions with ULBs and SPCBs, in addition to inputs from the Fifteenth Finance Commission guidelines, suggest that all the 131 non-attainment cities are currently working towards identifying pollution hotspots and developing plans for managing them.
The focus of this study was to develop a methodology that aids ULBs in prioritising action and improving the decisionmaking process to maximize impact. We have developed an extensive set of quality control protocols for dispersed source mapping like recommending 10-meter location accuracy in the app and incorporating control points for route mapping, including tertiary roads. It aids any inspection team unfamiliar with the terrain to cover all relevant locations, thereby ensuring thorough spatial coverage.
In addition to identifying and listing dispersed pollution sources, we also included a tool for prioritisation for remedial action- the Composite Ward Score (CWS). This custom indicator identifies wards needing immediate attention, thereby guiding ULBs to optimise resource allocation. The CWS’s applicability is independent of the city size, making it a universally applicable solution for cities across India and beyond.
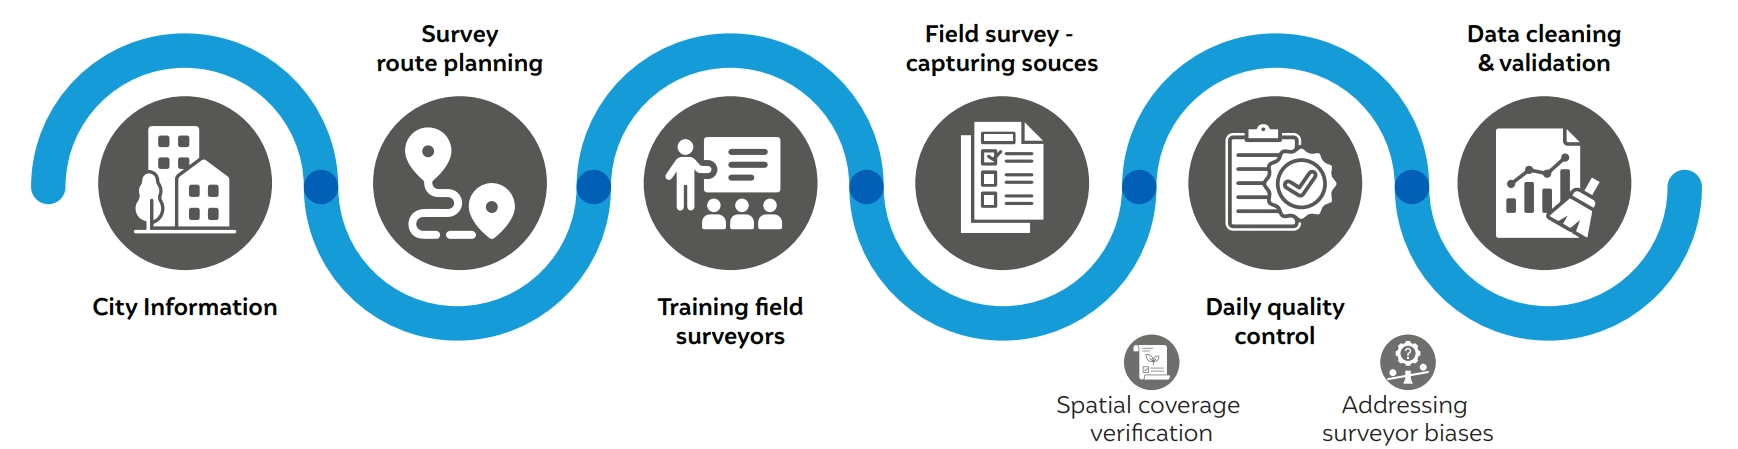
A field reconnaissance survey involves a team of field surveyors going around the city to digitise dispersed sources of air pollution at the neighbourhood level. The operational process of the field survey includes sequential steps like survey route planning, training of field surveyors, field survey, and data management.
Step 1: Ward-level route planning. Each ward’s target roads (primary roads, secondary roads, and key tertiary/ quaternary roads) are pre-marked to guide the field surveyor during the field reconnaissance. The field surveyors are trained to use the route plans on Google Maps during the field survey exercise.
Step 2: Ward-level survey protocol design. A simple, quick, easy-to-implement tool to collect user-friendly information on hyperlocal emission sources was designed. The emission sources chosen are comparable to those recommended by the Central Pollution Control Board (CPCB) in its prescribed method for conducting emission inventories and source apportionment studies. However, our method also focuses on the less studied sources for which emission factors are unavailable at the national level. We have attempted to capture 17 different sources, including fugitive emission sources such as burning garbage, construction areas, road dust, diesel generator (DG) sets, and construction and demolition (C & D) waste dumps.
Figure ES 1 Steps to conducting a Field Reconnaissance Survey
Source: Authors’ compilation
Step 3: Open Data Kit (ODK) app to digitise dispersed source details: The next step would be to train field surveyors to use the ODK app to collect details such as date and time, source image, global positioning system (GPS) coordinates, and source-specific description for each source. For most sources, we compiled a point GPS location. However, for road dust, unpaved roads, and construction areas, multiple GPS locations of the same source must be collected in order to demarcate the precise boundary. Source-specific descriptions include details like phase of construction, building size, and type of construction (residential/commercial/road construction) for construction sources.
Step 4: Data repository and usage: The subsequent step is to input the gathered data into a cloud-based database with programmatic access. Programmatic access facilitates integration with servers of grievance redressal portals such as Sameer app (developed by the Central Pollution Control Board) and other integrated grievance redressal portals. Additionally, programmatic access facilitates various real-time applications like tracking resolution of the air pollution sources through an interactive dashboard, dynamically updating city-level insights on top polluting air pollution sources and most polluted wards/hotspots.
We developed a quality assurance protocol to ensure that the data collected during the survey is representative of the area covered by the field surveyor. This protocol can be customised to aid implementing agencies in remote monitoring. Automating data collection and real-time reporting can improve the efficiency of inspection teams. The following components were included for quality assurance and control:
Spatial coverage verification
In order to ensure optimum coverage of the wards, data managers monitor the regions of insufficient coverage by overlaying the actual route traversed by field surveyors over the pre-set ward route plan that covers all the primary, secondary, and tertiary roads in each ward. This check is done daily for each ward. Field surveyors are asked to re-cover the ward if the coverage is unsatisfactory. To ensure objectivity, we have developed a ‘spatial coverage metric’, a proxy to assess the quality of spatial coverage by field surveyor.
Spatial coverage metric (SCM) = {(Number of control points captured within a ward ) / (Number of control points preset on ward route plan)} × 100
In order to develop this metric, we pre-marked an evenly placed set of reference control points that the field surveyors are mandated to capture on the ward route plan. The field surveyors are instructed by the data managers to re-do the ward, if the SCM for that ward has dropped below 75 per cent. This two-step quality assurance/quality control (QA/QC) method ensures a thorough, high-quality survey covering almost every locality within a city.
Validating accuracy of the location data captured by overlaying with Google satellite imagery
The ODK survey form interface must be conditionally coded to not collect or accept any GPS coordinate with a location deviation more than 10 metres. This needs to be supported by validation of the captured location data by overlaying them on Google satellite imagery. At times, some rectification of the captured location data would be needed, especially for area sources, where minor location errors add up to create displaced polygons in location data.
Addressing surveyor observational biases and feedback discussions
As a final step in ensuring quality, there should be day-to-day feedback discussions with the field surveyors. The discussions should be centred on reducing the observational biases in capturing sources to the field surveyors that facilitate course correction and continuous improvement of the survey quality.
Identification of pollution hotspots is crucial so as to focus mitigation efforts on areas that disproportionately contribute to the city’s total polluting sources. Hotspot management is also identified as one of the components under the implementation of NCAP. This is mainly required to offset the resource crunch faced by ULBs. Furthermore, competing insights from different factors often perplex ULBs while taking an actionable decision.
To address these issues, we have developed a Composite Ward Score (CWS), which is a spatial prioritisation matrix used for ranking the wards, to prioritise action.
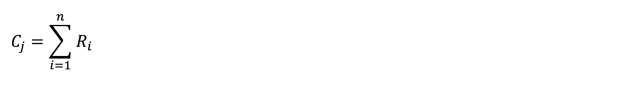
where Cj is the composite rank value of the jth ward and Ri is the rank of an individual factor.
CWS is calculated by combining the individual ranks of four priority factors. The four priority factors considered for calculating CWS are as follows:
Wards can be ranked in order of priority of action using the CWS. Actions could be prioritised in the ward with the greatest CWS first, while the ward with the lowest CWS would be considered last.
Our report provides simple protocols that can be used by implementation agencies in non-attainment cities to generate a comprehensive database of hyperlocal emission sources. It generates actionable insights faster than the more resource-intensive source apportionment studies. Additionally, the Composite Ward Score, developed by us, enables ULBs to prioritise localities/ wards that need immediate attention. The score also helps identify locations where abatement measures will bring maximum air quality improvement.
Additionally, our findings emphasise the importance of hyperlocal sources, which when considered in aggregate, contribute significantly to worsening air quality. As a result, these should be prioritised for abatement, involving broad participation from both industries and the general public. The data analysis shows that the distribution of sources is not uniform across the city
Based on our analysis, we propose the following recommendations for various entities involved in controlling air pollution:
In January 2019, the Ministry of Environment, Forest and Climate Change (MoEFCC) introduced the National Clean Air Programme (NCAP) to improve air quality in 131 cities, including non-attainment cities and Million Plus Cities, across 24 States/UTs. The programme envisages achieving reductions up to 40 per cent or achievement of National Ambient Air Quality Standards for Particulate Matter10 (PM10) concentrations by 2025-26.
Emission Inventory is a detailed record of the amount and types of pollutants released into the air from various sources. It provides detailed quantitative data on pollutants in units such as kilograms or tons per unit of activity. Source Apportionment is the process of determining the contribution of different sources to observed air pollution levels. It helps identify the percentage contributions of different sources to observed air pollution levels, often measured in micrograms per cubic metre or as a percentage of the total pollution load.
Hyperlocal air pollution sources refer to specific, localised, and recurring sources contributing to air pollution in a specific geographic area. Hyperlocal sources have a more immediate and concentrated impact on the air quality of a particular neighbourhood and, consequently, the overall city. We have attempted to capture 17 hyperlocal sources, including open waste burning, construction sites without safeguards, road dust, diesel generator (DG) sets, and construction and demolition (C & D) waste dumps.
Assessing Effectiveness of India’s Industrial Emission Monitoring Systems
Best Practices in CEM (Continuous Emission Monitoring)
What is Polluting India’s Air? The Need for an Official Air Pollution Emissions Database
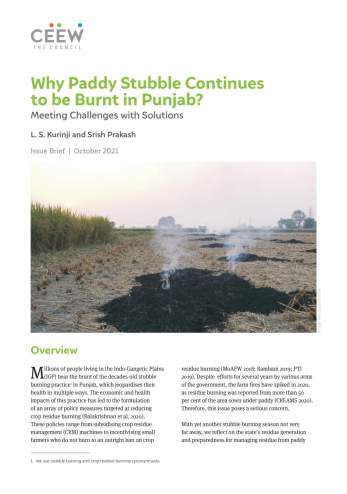
Why Paddy Stubble Continues to be Burnt in Punjab?