Council on Energy, Environment and Water Integrated | International | Independent
With increased air pollution levels, several regions of Northern India continue to gasp for breath. Air quality in Delhi was in the ‘very poor’ category in the last days of October, and went into the ‘severe’ category for the first time this year on 30 October.
The Council on Energy, Environment and Water has been tracking PM 2.5 levels and open fire counts across Delhi and neighbouring states. We have been monitoring air quality in rural areas of Punjab since mid-October. Our Risks and Adaptation team installed 48 low-cost sensors in four districts of Punjab - Ludhiana, Sangrur, Hoshiarpur and Pathankot - to track air quality in the state.
For daily updates, follow us on Twitter.
Source: Niti Gupta/ CEEW
We have been tracking PM 2.5 concentration across Delhi since the last few days. On 31 October, the average PM 2.5 concentration in Delhi was in ‘very poor category’ at 208.4. The highest value was 591, recorded at Rohini station (North-west) at 0800 hours. The PM 2.5 concentration shot up into the ‘severe category’ indicating an overall worsened air quality condition all over Delhi.
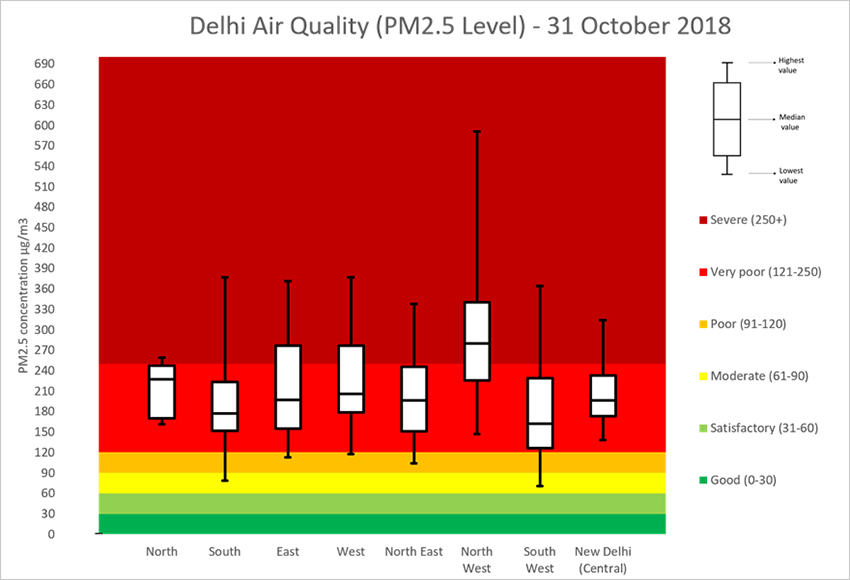
Source: CPCB (retrieved from: openaq.org)
Below is our trend analysis for PM 2.5 concentration across Delhi. It summarises the overall air quality for the city to give a sense of variation across days. In the first 15 days of October, the air quality varied between moderate and poor. The trend in the second half of the month has been upwards from ‘poor’ to ‘very poor’ category. On October 30, the average concentration touched the ‘severe’ category at the value of 286 for Delhi.
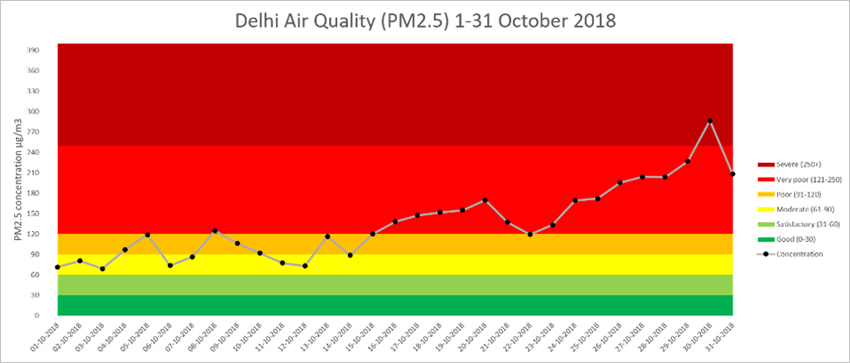
Source: CPCB (retrieved from: openaq.org)
Open fires (from all sources) were observed through satellite imagery (NASA) across Punjab, Haryana, and Western UP since the last few days. The aggregate fire count on 1 November 2018 increased to 3705, up from 2974 on 31 October 2018.
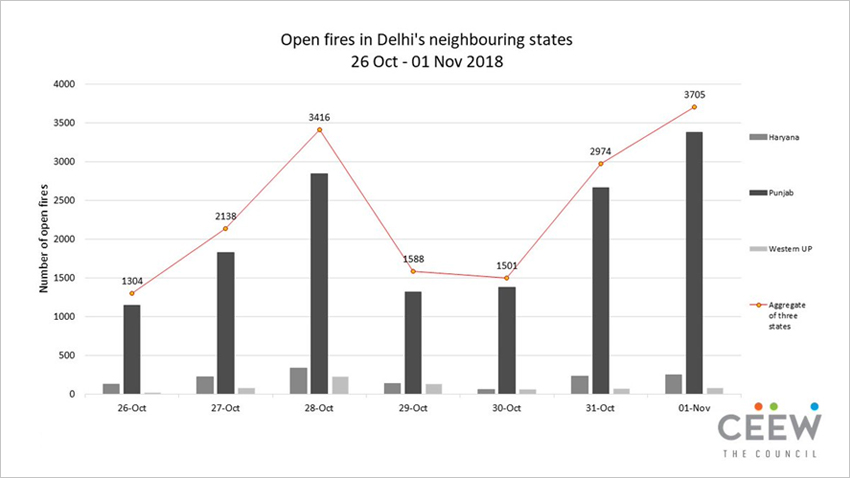
Source: NASA NRT VIIRS 375m
https://earthdata.nasa.gov/firms
*Open fires from any burning, detected by the satellite.
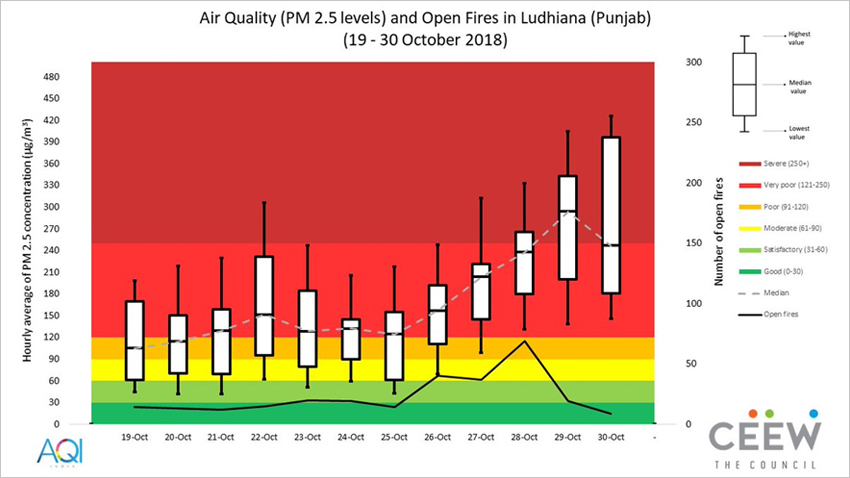
Source: PM 2.5 data from 16 Purelogic Labs sensors installed by CEEW and open fire counts data from NASA NRT VIIRS 375m
*Open fires from any burning, detected by the satellite.
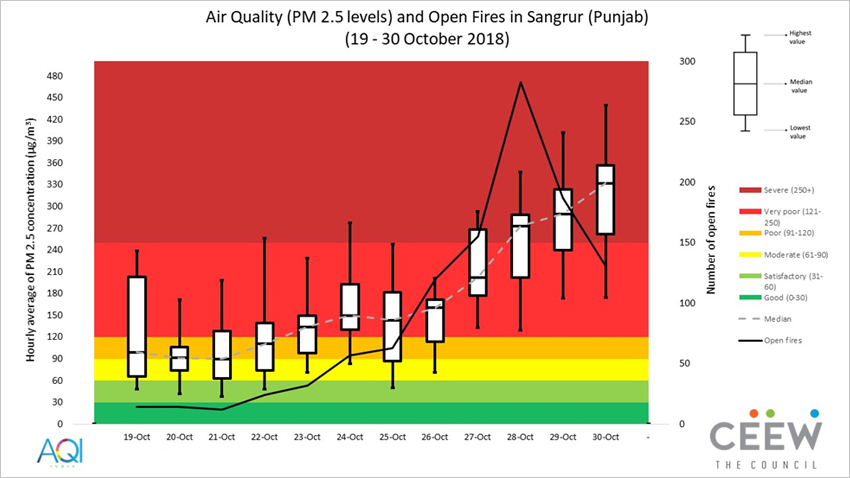
Source: PM 2.5 data from 12 Purelogic Labs sensors installed by CEEW and open fire counts data from NASA NRT VIIRS 375m
*Open fires from any burning, detected by the satellite.